The XY Graph Control |
| The XY Chart control is a GUI element that can be used to display one or more graphs. The XY Chart control has a collection of graphs. Each graph has a color, a caption, a type and a collection of xy values. A graph can be added to a XY graph control using the method Add of the control. El control de XY Chart es un elemento GUI que puede ser usado para mostrar una o más gráficas. El control de XY Chart tiene una colección de gráficas. Cada gráfica tiene un color, un texto, un tipo y una colección de valores xy. Una gráfica puede ser agregada a un control de XY Chart usando el método Add del control. |
| Problem 1 |
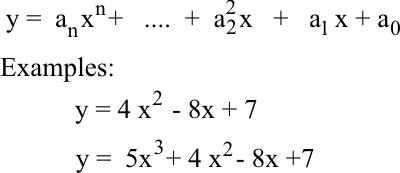
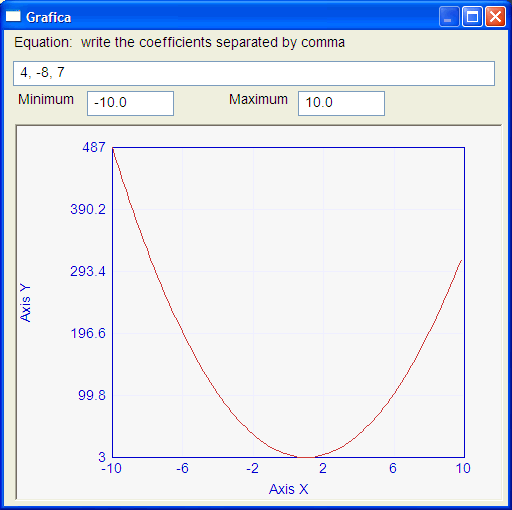
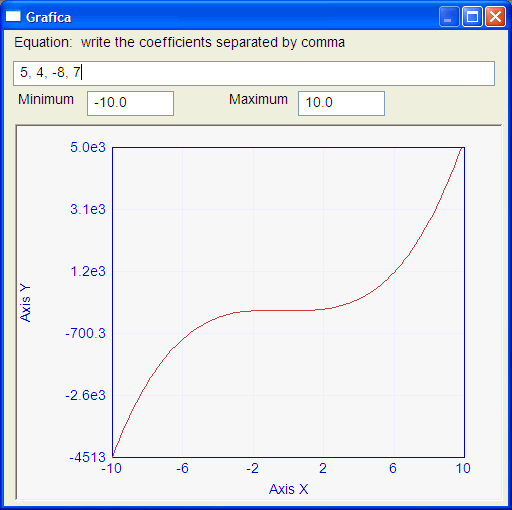
| Write a program called Grafica to plot any polynomial as shown below. The user must input the polynomial coefficients separated by comma. The user must also provide an initial value and a final value for x. Escriba un programa llamado Grafica para graficar un polinomio como se muestra debajo. El usuario debe introducir los coeficientes del polinomio separados por coma. El usuario debe también proporcionar un valor final y un valor final para x. |
| Grafica.h |
| #pragma once //______________________________________ Grafica.h #include "resource.h" class Grafica: public Win::Dialog { public: Grafica() { } ~Grafica() { } void RefreshGraph(); double EvaluateFunction(const valarray<double>& coefficients, double x); double Power(double x, int exponent); protected: ... }; |
| Grafica.cpp |
| void Grafica::Window_Open(Win::Event& e) { //________________________________________________________ xyMain xyMain.CaptionX = L"Axis X"; xyMain.CaptionY = L"Axis Y"; xyMain.MinX= 0.0; xyMain.MaxX= 10.0; xyMain.MinY= -1.0; xyMain.MaxY= 1.0; xyMain.Graphs.Add(100); // We add one graph. The graph has 100 points for(int i=0; i<100; i++) { xyMain.Graphs[0][i].x = 0.0; xyMain.Graphs[0][i].y = 0.0; } //xyMain.Graphs[0].Color = RGB(0, 0, 255); //xyMain.Graphs[0].Type(Win::Graph::circle); xyMain.RefreshAll(); } void Grafica::tbxCoefficients_Change(Win::Event& e) { RefreshGraph(); } void Grafica::tbxMinimum_Change(Win::Event& e) { RefreshGraph(); } void Grafica::tbxMaximum_Change(Win::Event& e) { RefreshGraph(); } void Grafica::RefreshGraph() { if (tbxCoefficients.Text.length() == 0) return; // No coefficients, no update // const double minX = this->tbxMinimum.DoubleValue; const double maxX = this->tbxMaximum.DoubleValue; if (minX >= maxX) return; //__________________________________________ Extract the coefficients valarray<double> coefficients; Sys::Convert::ToVector(tbxCoefficients.Text, coefficients); const int order = coefficients.size()-1; if (order <= 0) return; //__________________________________________ We get here, when everything is OK! xyMain.MinX= minX; xyMain.MaxX= maxX; const double deltaX = (maxX-minX)/100; double x = 0.0; for(int i=0; i<100; i++) { x = minX + i*deltaX; xyMain.Graphs[0][i].x = x; xyMain.Graphs[0][i].y = EvaluateFunction(coefficients, x); } xyMain.AutoScaleY(); xyMain.RefreshAll(); } double Grafica::EvaluateFunction(const valarray<double>& coefficients, double x) { } // exponent = 2, returns x*x // exponent = 3, returns x*x*x // exponent = 4, returns x*x*x*x double Grafica::Power(double x, int exponent) { } |
| Problem 2 |
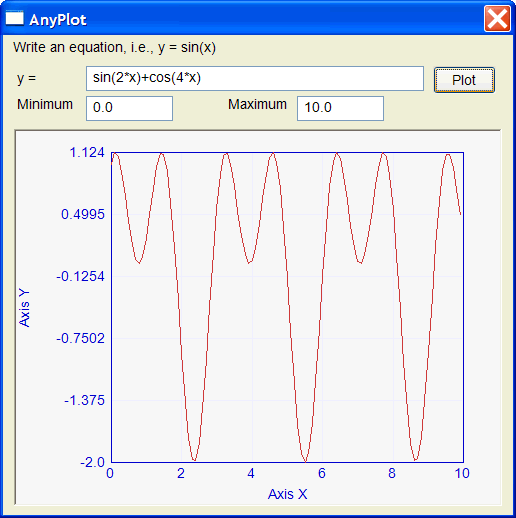
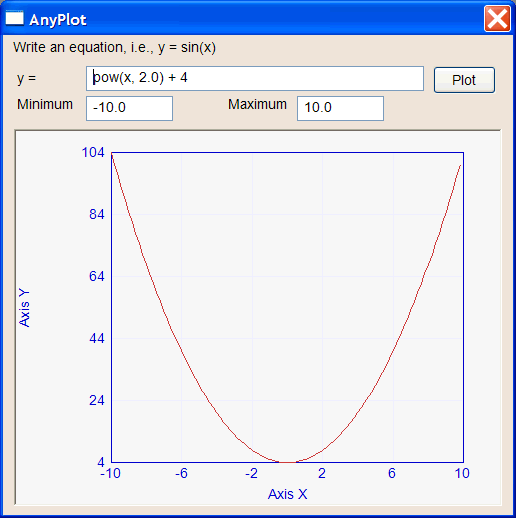
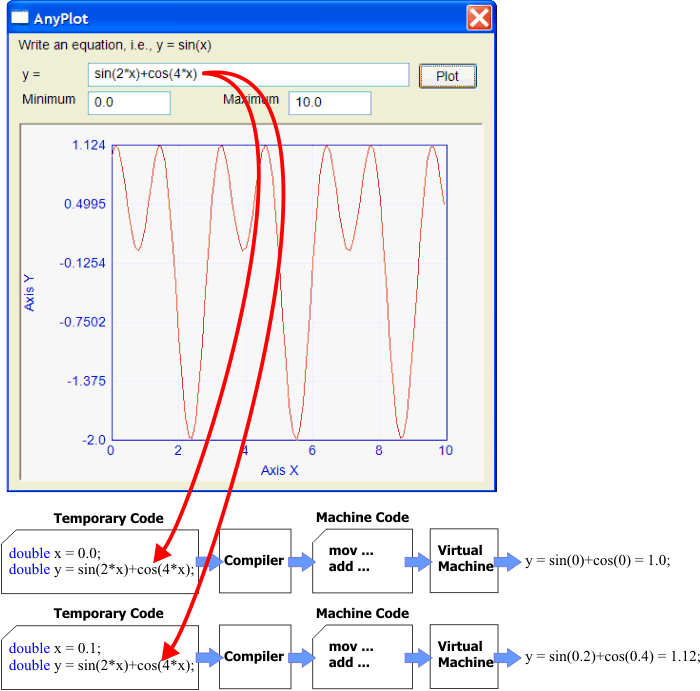
| Write a program called AnyPlot to plot any function y = f(x). This exercise creates a source code with only two double variables x and y. The code is, then, compiled and executed. Escriba un programa llamado AnyPlot para graficar cualquier función y = f(x). Este ejercicio crea un código fuente con solo dos variables double x y y. El código es, entonces, compilado y ejecutado. |
| AnyPlot.h |
| #pragma once //______________________________________ AnyPlot.h #include "resource.h" class AnyPlot: public Win::Dialog { public: AnyPlot() { } ~AnyPlot() { } double ComputeY(double x); protected: ... }; |
| AnyPlot.cpp |
| void AnyPlot::Window_Open(Win::Event& e) { //________________________________________________________ xyMain xyMain.CaptionX = L"Axis X"; xyMain.CaptionY = L"Axis Y"; xyMain.MinX= 0.0; xyMain.MaxX= 10.0; xyMain.MinY= -1.0; xyMain.MaxY= 1.0; xyMain.Graphs.Add(100); // We add one graph. The graph has 100 points for(int i=0; i<100; i++) { xyMain.Graphs[0][i].x = 0.0; xyMain.Graphs[0][i].y = 0.0; } xyMain.RefreshAll(); } void AnyPlot::btPlot_Click(Win::Event& e) { const double minX = this->tbxMinimum.DoubleValue; const double maxX = this->tbxMaximum.DoubleValue; if (minX >= maxX) return; //__________________________________________ We get here, when everything is OK! xyMain.MinX= minX; xyMain.MaxX= maxX; const double deltaX = (maxX-minX)/100; double x = 0.0; for(int i=0; i<100; i++) { //_________________________________________ Compute x and y x = minX + i*deltaX; xyMain.Graphs[0][i].x = x; xyMain.Graphs[0][i].y = ComputeY(x); } xyMain.AutoScaleY(); xyMain.RefreshAll(); } double AnyPlot::ComputeY(double x) { //___________________________________ Create the source code wstring sourceCode; Sys::Format(sourceCode, L"double x = %g; double y = %s;", x, tbxEquation.Text.c_str()); //___________________________________ Compile: source code >> machine code vector<Cpl::Compiler::Instruction> machineCode; Cpl::Compiler compiler; compiler.Compile(sourceCode.c_str(), machineCode); //___________________________________ Execute the machine code Cpl::VirtualMachine virtualMachine; Mt::BoolTs running; Mt::DoubleTs progress; Mt::BoolTs resetTime; virtualMachine.Setup(compiler.variableInfo, machineCode, L"dummy"); running.Set(true); virtualMachine.ThreadFunc(running, progress, resetTime); //____________________________________ Return the value of y return virtualMachine.memDouble[1]; // memDouble[0] is x, memDouble[1] is y } |
| Solution 2 |
As the user can write any function in the textbox, the program must create a temporary code to compute the value of y for each value of x as shown in the figure. The function ComputeY:
Como el usuario puede escribir cualquier función en la caja de texto, el programa debe crear un código temporal para calcular el valor de y para cada valor de x como se muestra en la figura. La función ComputeY:
|
| Problem 3 |
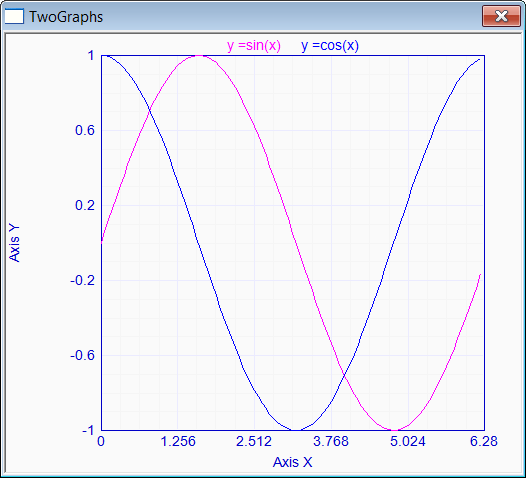
| Write a program called TwoGraphs to plot: y = sin(x) and z = cos(x) . Escriba un programa llamado TwoGraphs para graficar: y = sin(x) y z = cos(x). |
| Problem 4 |
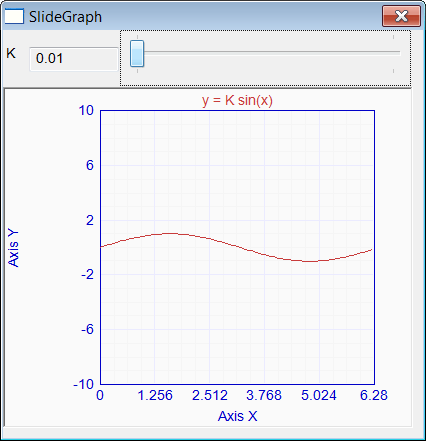
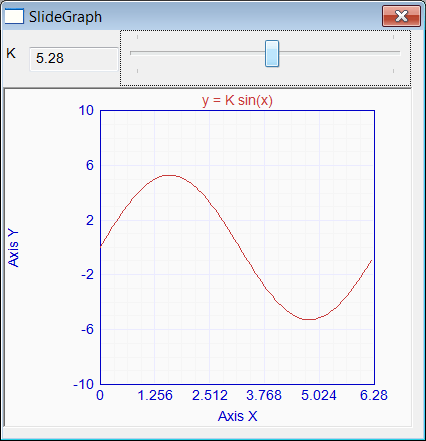
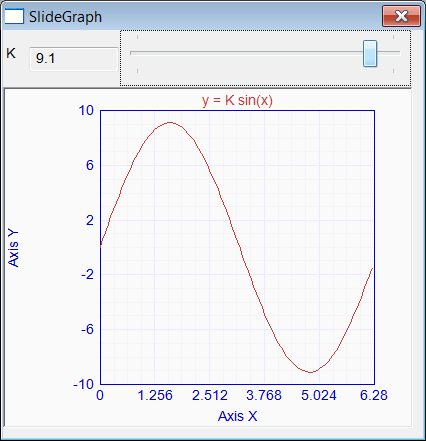
| Write a program called SlideGraph to plot: y = k sin(x) for any value of K between 1 to 10 . Escriba un programa llamado SlideGraph para graficar: y = k sin(x) para cualquier valor de K entre 1 y 10. |
